The screen share started on a Tuesday afternoon in September. A joinery firm outside Varna, eleven months into a search campaign, four keywords, one landing page. Cost per lead had been 38 euros in the spring. It was 54 now. The owner had the change history already open when we joined, because he had guessed that would be the first thing we asked for, and it showed nothing: one budget nudge in March and then eight months of silence.
He asked the question everyone asks. So what changed?
Cost per lead is three measurements multiplied together: how many clicks you bought, what each one cost, and what share of them turned into an enquiry. A 40 percent rise means at least one of those three moved, and usually only one. Finding out which one takes about twenty minutes, and it saves you from the weeks of bid fiddling that normally follow.
Rule out the measurement before you diagnose the market
A conversion that quietly stopped firing is indistinguishable, in the dashboard, from a cost per lead increase. So is a conversion that started firing twice. Both are common, and both get treated as performance problems for a month or two before anyone checks.
Three checks, in this order:
- Submit your own form and ring your own number. Then confirm the conversion appears under Goals, Conversions in Google Ads within a day, with the count setting you expect. Use one conversion per click for enquiries and every conversion for purchases.
- Ask the developer what shipped. A new page template, a redesigned form, a consent banner update, a tag manager change. We have opened accounts where the thank you page fired the tag on every refresh.
- Count the actual enquiries. Open your inbox and your call log for one month and compare the real number against the reported one. If they do not reconcile, stop. Nothing below this line means anything yet. We wrote about this reconciliation separately in conversion tracking that counts real enquiries.
A fair share of these emergencies end here. The leads were arriving the whole time.
Then work out which of the three numbers moved
Pull a 90 day window against the previous 90 days, and against the same 90 days last year. Monthly comparisons in a low volume account will swing 40 percent on noise alone. Then put impressions, clicks, click-through rate, cost per click and conversion rate side by side and find the one that is out of line.
If cost per click rose and conversion rate held, you are paying more for the same traffic. That is an auction problem: new competition, or a broader query mix, or both.
If conversion rate fell and cost per click held, you are buying the same traffic and converting less of it. That is a page, offer or query intent problem, and it lives on your side of the wall.
If both moved a little, that is the most common finding and it is a real answer, not a failure to find one. Several things got slightly worse at once.
The causes that are yours
Query mix drift. The quiet one. Nothing in the account changed, but what Google is willing to match you to has loosened year on year, and the share of your spend sitting on early stage, loosely related searches creeps up. Export search terms for the current period and the same period last year from Campaigns, Insights and reports, Search terms. Bucket them and compare the mix rather than the top twenty rows. There is more on how to read that report in our guide to reading search terms reports.
Landing page changes. Someone added a required phone field. Someone added a cookie banner that covers the button on a 375 pixel screen. Someone’s hero image went from 80 kilobytes to 2 megabytes. Nobody connected any of it to the ad account, because why would they.
Offer decay. Your offer was distinctive two years ago. Now three competitors say the same sentence. The ad has not changed and has become ordinary anyway, and no report in Google Ads will tell you this. Search your own main keyword and read what the other advertisers are promising today.
The causes that are not yours
Two changes in 2026 moved reported cost per lead in a lot of accounts without anyone touching the account.
First, bidding. From 17 August 2026 Google changed how target based bid strategies behave in campaigns that are limited by budget. Campaigns that used to appear to beat their Target CPA now spread the same budget across a wider set of auctions and report closer to the target you set. Google’s own example is a campaign achieving a 5 dollar cost per acquisition against a 10 dollar target, which will now deliver nearer 10. If your reported cost per lead rose in late August for no campaign reason, check whether the campaign is budget limited and what the target says. The target was probably set years ago by someone who is no longer at the company.
Second, matching. From September 2026 Google began automatically upgrading campaigns that used automatically created assets or the campaign level broad match setting into AI Max, which turns on keywordless search term matching by default. If your account had either of those switched on, the set of searches you appear for widened without an edit in the change history. Look at the account change history including automatic changes, not only your own.
Then there is the one nobody can switch back. The results page itself has fewer clicks on it. Seer Interactive tracked 3,119 search terms across 42 organisations between June 2024 and September 2025 and found paid click-through rate on queries carrying an AI Overview fell from 19.7 percent to 6.34 percent, against 13.04 percent on queries without one. That is informational queries, which is the softer end of a lead generation account, so do not read it straight across. But if a chunk of your keywords sit on question-shaped searches, part of your increase is the page itself and no setting will give it back. That is the finding we least enjoy delivering, because there is nothing to fix and nothing to blame.
On benchmarks, briefly
WordStream’s 2026 search advertising benchmark report puts the all-industry average cost per lead at 66.69 dollars and average cost per click at 5.42 dollars, drawn from Google and Microsoft Ads campaigns between April 2025 and March 2026, as reported by Search Engine Journal. We would not use it as a target. It is a vendor averaging its own US client base, and the spread between categories is roughly fivefold, from the high twenties in arts and entertainment to over 130 dollars in legal services. The only number that governs your account is the one you calculate from your own gross profit and close rate, which is the first thing we work out in any marketing optimisation engagement.
Accept too that some of the rise is permanent. If your cost per lead is 20 percent above 2024 and the three component metrics are otherwise healthy, the honest options are a better close rate or higher prices, not another month of chasing the old figure.
The hour, in order
- Live test submission. Confirm it lands in Google Ads.
- Reconcile one month of reported conversions against your inbox and call log.
- Change history for the full period, automatic changes included.
- Impressions, clicks, CTR, cost per click and conversion rate, 90 days against 90 days and against last year. Name the one metric that moved.
- Search terms export for both periods, compared as a mix.
- Auction insights, looking for new names and rising impression share.
- Search your own keyword on a phone and read the competition.
Stop at the first material finding.
The joinery firm was mostly the fourth item on that list: cost per click had barely moved, conversion rate had dropped by a third, and the form had grown two required fields in a redesign in April that nobody had mentioned. We put it back to three fields. What we still cannot explain is why the enquiries that do arrive are closing at roughly half the spring rate on the same quoted prices. He thinks the market has gone soft. We think two new competitors are undercutting him by about fifteen percent and he has not looked. Neither of us has checked yet.
 Business Club Varna2 years, 140+ members, zero ad spend
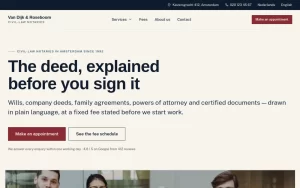 Van Dijk & RoseboomPublished fees, Dutch and English as equals
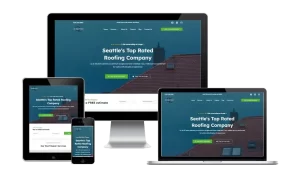 Construction Elite RoofingCost per booked job cut by 41%
 Mascot MilleniumBuyers from 12 countries in year one
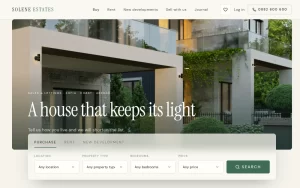 Solene EstatesLive filtering across sale and rental
 Ignite Art UniversityFiltered course finder, ten degrees
 Marchetti Italian FurnitureSeparate catalogue and bespoke paths
 KUKUIPart of the team managing $8M+ a year